Functions
Math
SUM
How to Use Excel's SUM Function in Pandas
Excel's SUM function calculates the sum of a range of values. This simple yet powerful function is essential in many analytical tasks, ranging from financial modeling to scientific data analysis.
This page explains how to implement Excel's SUM function in Python using pandas, thus helping automate Excel reports with the power of Python.
Use Mito's SUM function
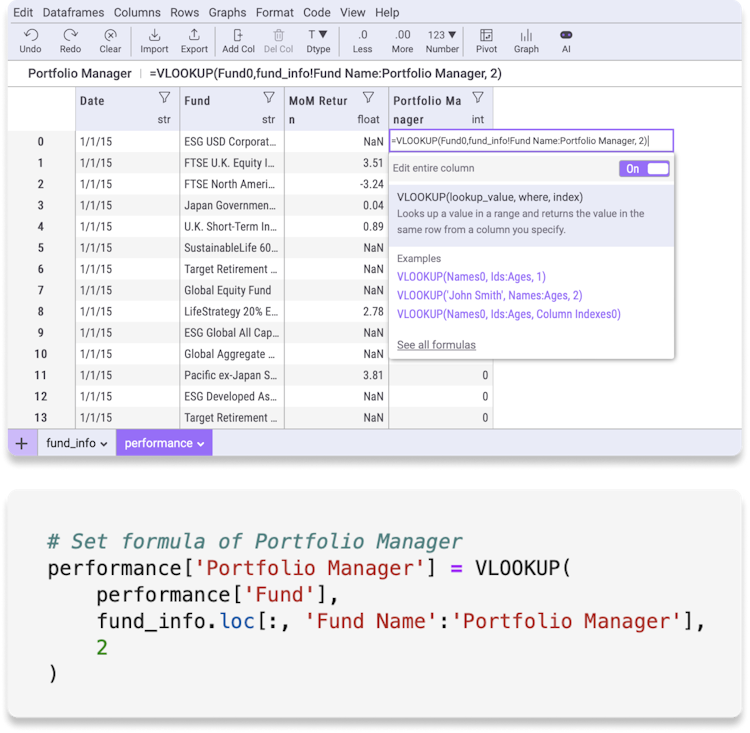
Mito is an open source library that lets you write Excel formulas in Python. Either write the formula directly in Python or use the SUM formula in the Mito Spreadsheet and generate the equivalent Python code automatically.
Mito's SUM function works exactly like it does in Excel. That means you don't need worry about managing data types, handling errors, or the edge case differences between Excel and Python formulas.
Install Mito to start using Excel formulas in Python.
# Import the mitosheet Excel functions
from mitosheet.public.v3 import *;

# Use Mito's SUM function
df['sum'] = SUM(df[['Col1', 'Col2']])
Implementing the Addition function in Pandas#
To replicate the SUM function in Excel using Python and pandas, you have several options depending on your specific needs. Here are some common implementations:
Summing values in the same row#
Calculating the sum of values in a row is as simple as entering =SUM(A1, B1) in Excel.
The syntax for summing values in the same row in pandas is similar to Excel. The following code creates a new column called Total that contains the sum of values in columns Col1 and Col2:
df['Total'] = df['Col1'] + df['Col2']Summing a single column#
Calculating the sum of a column in Excel is as simple as entering =SUM(A:A). To calculate the sum of a single column in pandas, use the sum method on the column:
total = df['Column1'].sum()Summing an entire dataframe#
Calculating the sum of an entire table in Excel is as simple as entering =SUM(A1:D10). To calculate the sum of a single an entire pandas dataframe, use the following code:
total = df.sum().sum()Rolling Sum#
A rolling sum calculates the sum of values in a sliding window of rows. For example, a rolling sum of size 3 would calculate the sum of the current row and the two previous rows.
To calculate a rolling sum in Excel, the formula in B5 would look like this: =SUM(A3:A5). The range A3:A5 is relative, so when you copy the formula to B6, the range will shift to A4:A6
To calculate a rolling sum in pandas, use the rolling method:
df['Rolling_Sum'] = df['Column1'].rolling(window=3).sum()Cumulative Sum#
The cumulative sum is the sum of values from the start of the dataset to the current row. You could calculate the cumulative sum of column A in Excel using the following formula in B5: =SUM($A$1:A5) or =SUM(B4, A5).
To calculate the cumulative sum in pandas, use the cumsum method:
df['Cumulative_Sum'] = df['Column1'].cumsum()Weighted Sum#
To sum values in a column based on weights in another column, multiply the values and weights together and then sum the result:
df['Weighted_Sum'] = (df['Values'] * df['Weights']).sum()Common mistakes when using SUM in Python#
Implementing the SUM function in pandas can have some pitfalls if you're not careful. Here are some common mistakes and how to avoid them.
Ignoring Missing Values#
Pandas might not handle `NaN` values as you'd expect during summation, leading to unexpected results. By default, `.sum()` skips `NaN` values, just like how Excle's SUM function ignores blank cells.
# Fill NaN values with 0 before summing
df['Column1'] = df['Column1'].fillna(0)

# Calculate the sum
total = df['Column1'].sum()Data Type Mismatch#
Attempting to sum columns with non-numeric data types raises a TypeError. Your data must be either a float or decimal before calculating the sum.
# Convert to numeric and then sum
df['Column1'] = pd.to_numeric(df['Column1'], errors='coerce')
total = df['Column1'].sum()Trying to Sum a Column of $ Amounts#
If a column contains $ signs or other non-numeric characters, direct summation will result in a TypeError. You can use the replace method to remove non-numeric characters from strings before summing.
# Remove $ sign and convert to float
df['Amount'] = df['Amount'].replace('[\$,]', '', regex=True).astype(float)

total = df['Amount'].sum()Axis Confusion#
It's easy to get confused about which axis to sum over. Make sure you're summing rows (axis=1) or columns (axis=0) as needed.
# Summing across rows
df['Total'] = df[['Col1', 'Col2']].sum(axis=1)

# Summing down columns
column_total = df[['Col1', 'Col2']].sum(axis=0)Understanding the Addition Formula in Excel#
The SUM function in Excel takes one or more arguments (ranges of numbers) and returns their sum.
=SUM(number1, [number2], ...)
SUM Excel Syntax
| Parameter | Description | Data Type |
|---|---|---|
| number1 | The first number you want to sum. | number |
| number2 | (Optional) The second number you want to sum. You can input up to 255 numbers. | number |
| ... | (Optional) Add up to 255 numbers in total. | number |
Examples
| Formula | Description | Result |
|---|---|---|
| =SUM(1, 2) | Calculate the sum of values from 1 and 2. | 3 |
| =SUM(A1:A10) | Calculate the sum of values from A1 to A10. | A1 + A2 ... A10 |
| =SUM(A1, B1) | Calculate the sum of values in cells A1 and B1. | A1 + B1 |
Get answers from your data, not syntax errors. Download the Mito AI analyst
Don't want to re-implement Excel's functionality in Python?
Edit a spreadsheet.
Generate Python.
Mito is the easiest way to write Excel formulas in Python. Every edit you make in the Mito spreadsheet is automatically converted to Python code.
View all 100+ transformations →