Functions
Math
AVERAGE
How to Use Excel's AVERAGE Function in Pandas
Excel's AVERAGE function calculates the mean of a range of values. This guide explains how to replicate Excel's AVERAGE functionality in Python using pandas.
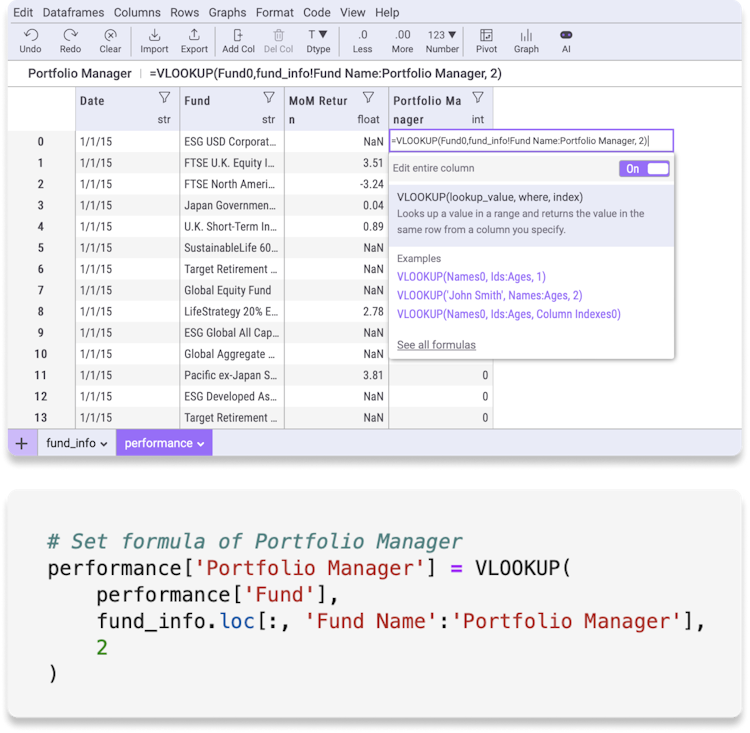
Use Mito's AVERAGE function
Mito is an open source library that lets you write Excel formulas in Python. Either write the formula directly in Python or use the AVERAGE formula in the Mito Spreadsheet and generate the equivalent Python code automatically.
Mito's AVERAGE function works exactly like it does in Excel. That means you don't need worry about managing data types, handling errors, or the edge case differences between Excel and Python formulas.
Install Mito to start using Excel formulas in Python.
# Import the mitosheet Excel functions
from mitosheet.public.v3 import *;

# Use Mito's AVERAGE function
df['Row_Average'] = AVG(df['Col1'], df['Col2'], df['Col3'])
Implementing the Average/Mean function in Pandas#
To mimic the AVERAGE function from Excel in pandas, there are several approaches depending on your specific needs. Here are some common implementations:
Average value in each row#
In Excel, to average values in cells A1, B1, and C1, you'd use =AVERAGE(A1, B1, C1).
In pandas, averaging values across columns for a given row can be done similarly. Below is how you'd compute an average of 'Col1', 'Col2', and 'Col3' for each row:
# Calculate the average of Col1, Col2, Col3
df['Row_Average'] = df[['Col1', 'Col2', 'Col3']].mean(axis=1)Entire column average#
In Excel, to find the average of an entire column, you'd use =AVERAGE(A:A).
In pandas, you can use the mean method on the desired column to get a similar result:
# Calculate the average of the entire column
col_avg = df['Column1'].mean()Entire dataframe average#
In Excel, to find the average of an entire table, you'd use =AVERAGE(A1:D10).
In pandas, you can use the mean method on the entire dataframe to get a similar result:
# Calculate the average of the entire dataframe
df.fillna(0).mean().mean()Weighted Average#
Weighted averages are useful when you want to compute an average that gives more importance to some values than others. For example, if you wanted to calculate the average return of your stock portfolio, you'd want to apply more weight to the stocks that you own more of to get an accurate understanding of your overall return.
To calculate a weighted average, multiply each value by a weight and then sum up the products before dividing by the sum of weights.
To calculate a weighted average in Excel, you'd use the formula =SUMPRODUCT(A1:A10, B1:B10) / SUM(B1:B10).
In Pandas, we can use the following code:
# Calculate the weighted average in a dataframe
weighted_avg = (df['values'] * df['weights']).sum() / df['weights'].sum()Geometric Mean of pandas Series#
The geometric mean is a type of average that is useful for finding the average growth rate of a quantity over time. For example, if you wanted to calculate the average growth rate of your stock portfolio over the past 5 years, you'd want to use the geometric mean because it accounts for the compounding effect of growth over time.
To calculate the geometric mean in Excel, you'd use the formula =GEOMEAN(A1:A10).
In Pandas, we can use the following code:
# Calculate the geometric mean in a dataframe
geometric_mean = df['values'].prod() ** (1 / len(df))Geometric Mean of pandas Dataframe#
If instead of calculating the geometric mean of a single column, you want to calculate the geometric mean of each row in a dataframe, you can use the following code:
# Calculate the geometric mean in a dataframe
df['geometric_mean'] = df.apply(lambda x: x.prod() ** (1 / len(x)), axis=1)Harmonic Mean of pandas Series#
The harmonic mean is a type of average commonly used in situations where you want to calculate an average rate or ratio. Its calculated by dividing the number of values in the dataset by the sum of the reciprocals of the values. Aka, the formula is: n / (1 / x1 + 1 / x2 + ... + 1 / xn).
The harmonic mean is particularly useful in scenarios like calculating average speeds. If you travel the same distance at different speeds, the harmonic mean gives a better average speed than the arithmetic mean. For instance, if you travel 60 km at 30 km/h and another 60 km at 60 km/h, the harmonic mean of the speeds (30 and 60 km/h) gives the correct average speed for the whole trip, which would not be the case if you used the arithmetic mean.
To calculate the harmonic mean in Excel, you'd use the formula =HARMEAN(A1:A10). In Pandas, we can use the following code:
# Calculate the harmonic mean in a dataframe
harmonic_mean = len(df) / (1 / df['values']).sum()Harmonic Mean of pandas Dataframe#
If instead of calculating the harmonic mean of a single column, you want to calculate the harmonic mean of each row in a dataframe, you can use the following code:
# Calculate the harmonic mean in a dataframe
df['harmonic_mean'] = len(df) / (1 / df).sum(axis=1)TRIMMEAN of pandas Series#
The TRIMMEAN is useful for finding the average of a dataset while ignoring outliers. It does this by removing a certain percentage of the largest and smallest values from the dataset before calculating the average of the remaining values.
To calculate the TRIMMEAN in Excel, you'd use the formula =TRIMMEAN(A1:A10, 0.1). In Pandas, we can use the following code:
def trimean(data, trim_percentage):
    # Sort the data
    sorted_data = sorted(data)

    # Calculate the number of elements to exclude from each end
    trim_count = int(len(data) * trim_percentage / 2)

    # Trim the data
    trimmed_data = sorted_data[trim_count: -trim_count]

    # Calculate and return the mean of the trimmed data
    return sum(trimmed_data) / len(trimmed_data)

# Calculate the TRIMMEAN in a dataframe
trimmed_mean = trimean(df['Values'], 0.9)Common mistakes when using AVERAGE in Python#
These are common mistakes (and solutions) that you might run into while calculating averages in Python.
Averaging Over Strings#
Attempting to calculate the average on columns with string values raises a TypeError. You must convert these strings to numeric types before computing the average.
For example, if you have values with the format $1.99, $2.99, etc. you must convert them to float values before calculating the average
# Convert $ values to float
df['Column'] = df['Column'].str.replace('$', '').astype(float)

# Calculate the average
avg = df['Column'].mean()Ignoring Missing Values#
Not managing `NaN` values correctly can lead to inaccurate averages. By default, pandas skips `NaN` values, similar to how Excel's AVERAGE function disregards blank cells. However, you can also choose to treat `NaN` values as 0 when calculating the average, or return NaN if any of the values are NaN.
# Create a sample dataframe
df = pd.DataFrame({'Column': [1, 2, 3, None]})

# Calculate average with NaN values
df['Column'].mean(skipna=False)        # Resut: NaN

# Calculate average without NaN values
df['Column'].mean(skipna=True)         # Result: 2.0

# Calculate average with NaN values treated as 0
df['Column'].fillna(0).mean() # Result: 1.5Understanding the Average/Mean Formula in Excel#
The AVERAGE function in Excel takes one or more arguments (ranges of numbers) and returns their mean.
=AVERAGE(number1, [number2], ...)
AVERAGE Excel Syntax
| Parameter | Description | Data Type |
|---|---|---|
| number1 | The first number you want to include in the average. | number |
| number2 | (Optional) Additional numbers you want to include in the average. | number |
| ... | (Optional) Add up to 255 numbers you want to include in the average. | number |
Examples
| Formula | Description | Result |
|---|---|---|
| =AVERAGE(1, 2, 3) | Calculate the average of values 1, 2, and 3. | 2 |
| =AVERAGE(A1:A10) | Calculate the average of values from A1 to A10. | Average of A1 to A10 |
Get answers from your data, not syntax errors. Download the Mito AI analyst
Don't want to re-implement Excel's functionality in Python?
Edit a spreadsheet.
Generate Python.
Mito is the easiest way to write Excel formulas in Python. Every edit you make in the Mito spreadsheet is automatically converted to Python code.
View all 100+ transformations →